Ez az oldal az Ön nyelvén jelenleg nem elérhető. Az automatikus fordítás a megtekinthető a Google Fordító segítségével.
A szolgáltatás biztosításáért nem vállalunk felelősséget, a fordított szöveget nem ellenőrizzük.
Ha további segítségre van szüksége, lépjen kapcsolatba velünk.
Revealing the secrets of glass
Glass is a non-crystalline (amorphous) solid formed by rapid melt quenching. At the atomic-scale, glass structure is typical of a supercooled liquid. However, glass simultaneously has all the mechanical properties of a solid on a macroscopic scale.
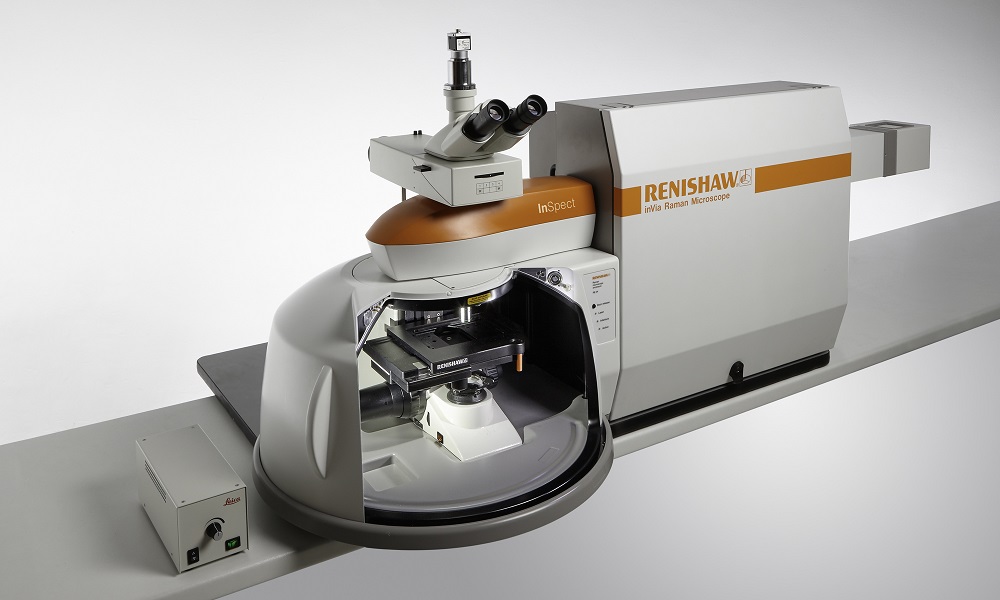
Raman spectroscopy is a powerful technique for analysing glass. It gives chemical and structural information, is non-destructive, and does not require any sample preparation. We used an inViaTM confocal Raman microscope to analyse the following glass samples.
Raman bands reveal structure and composition
Silica glass is a network of tetrahedral pyramids of silicon and oxygen (SiO4 units). Between 850-1300 cm-1, four Raman bands correspond to vibrational modes centred on tetrahedral silicon species  and these band positions are sensitive to boron oxide (B2O3) concentration. (3)
An inVia microscope was used to analyse a series of silica glass samples with varying boron oxide concentration. Data were collected using a 532 nm laser in seconds. Figure 1 shows two of the Raman spectra of borosilicate glasses with differing concentrations of B2O3. Changes to the Raman bands between 400-850 cm-1 indicate the possible formation of the superstructures of reedmergnerite [BSi3O8]- and danburite [B2Si2O8]2-.
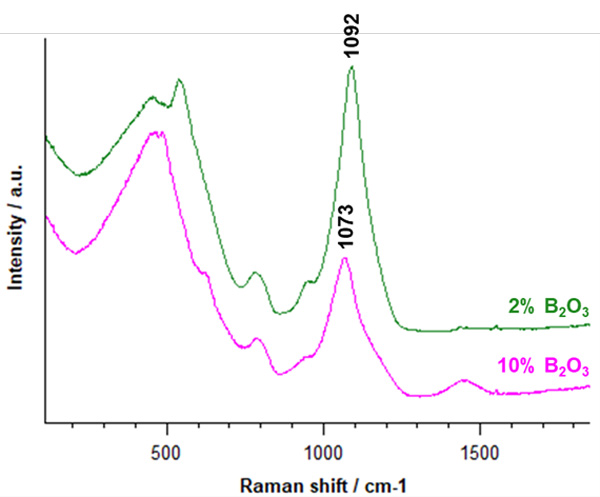
Figure 1 | Raman spectra of borosilicate glasses with different concentrations of B2O3. When the B2O3 concentration increases from 2% to 10%, the Raman band position corresponding to the  species shifts from 1092 cm-1 to 1073 cm-1.
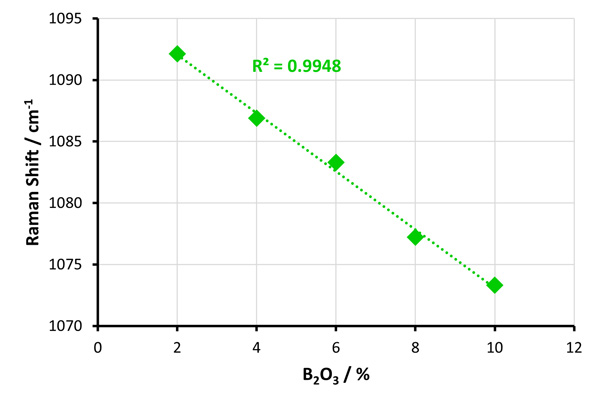 Figure 2 | Calibration plot of Raman band shift due to the
 ![]() silicon species against B2O3 concentration.
silicon species against B2O3 concentration.
Figure 2 shows the linear dependence of Raman band position ![]() against B2O3 concentration. The calibration plot can be used to infer the concentration of B2O3 and the expected physiochemical properties of a borosilicate glass, simply from the Raman band position
against B2O3 concentration. The calibration plot can be used to infer the concentration of B2O3 and the expected physiochemical properties of a borosilicate glass, simply from the Raman band position ![]() .
.
The inVia microscope can be used to determine the chemistry and structure of glass. Using the calibration model, glass of unknown B2O3 concentration can be accurately quantified. Both data collection and data analysis can be automated to make this process fast and simple.
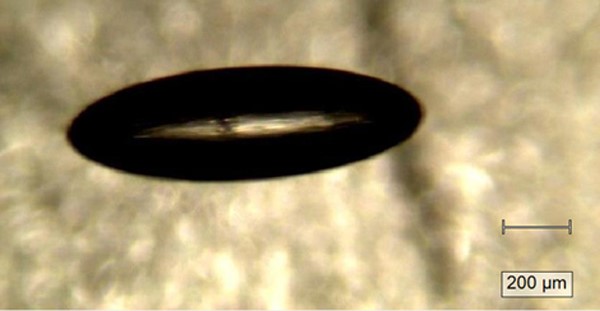
Figure 3 | Optical image of an inclusion in glass collected using transmitted illumination and a 5 objective on the inVia microscope.
Mysteries of gas inclusions in glass revealed
Inclusions are often observed as bubbles in glass. Inclusions can adversely affect the physical properties and the performance of glass. Inclusions can originate from trapped air, the decomposition of materials, or from galvanic oxidation-reduction reactions during glass production.
The inVia microscope can analyse microscopic inclusions with high spatial resolution. Using the EasyConfocalTM method, you can identify the chemistry and phase of materials within an inclusion. A high numerical aperture (NA) objective was used to maximise the spatial resolution, so the data contains as much information about the inclusion as possible. Figure 3 shows the optical image of an inclusion in glass using transmitted illumination.
Raman analyses of two different inclusions are shown in Figure 4. The Raman spectra were collected using a 532 nm laser. The spectrum in red includes Raman bands at 151, 218, 246, 437 and 470 cm-1 corresponding to solid sulphur. The spectrum in blue includes Raman bands at 1285 cm-1 and 1387 cm-1 corresponding to liquid carbon dioxide. Both inclusions also contain gaseous oxygen, as indicated by the Raman band present at 1555 cm-1. Identifying inclusions can help refine the materials and processes used during the manufacture of glass products and composites.
 Figure 4 | Raman spectra of the chemicals present in the glass inclusions.
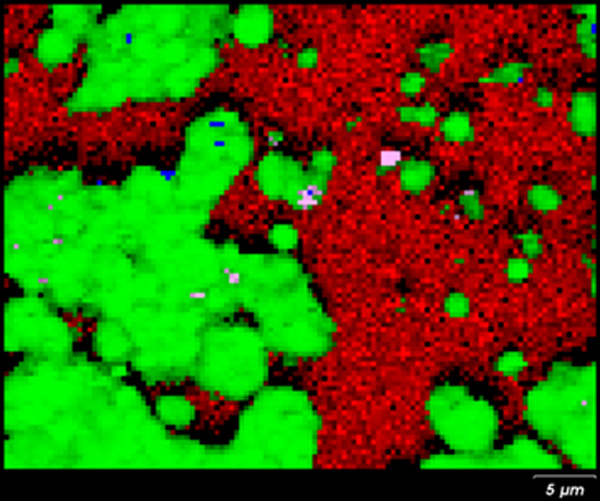
Figure 5 | High resolution Raman image of a stained region on the mirror surface, showing the presence of different components silver(I) chloride [green], glass [red], carbon [blue] and mixture cristobalite and magnesite [violet].
Improving the longevity of mirror coatings
Mirrors are typically comprised of glass with a reflective coating on one side. Mirrors appear in everyday objects and ornaments, but also sophisticated optical instruments like cameras, lasers, and Renishaw's Raman spectrometers. Since the invention of glass mirrors in the first century AD, different reflective coatings have been used in mirror manufacturing including lead, silver or tin-mercury amalgams and metallic silver. Modern mass-produced mirrors are produced by electroplating, chemical deposition or vacuum deposition of aluminium or silver coatings onto glass. (4)
Mirrors exposed to a humid environment will eventually degrade through tarnishing or corrosion. Protective coatings are often applied to mirrors to extend their lifetime. However, corrosive deterioration due to oxidation and chlorination reactions can still occur within both the reflective and protective layers. Glass or coating defects can act to accelerate corrosion.
Raman imaging can analyse the corroded interface between the glass substrate and its reflective coating. Again, the high confocal performance of an inVia microscope is important for this type of work. A green 532 nm laser excitation was used; which is ideal for the analysis of inorganics.
Figure 5 shows the high-resolution Raman image of a corroded mirror. In corrosion-free regions, only glass is detected [red]. In the corroded areas, Raman analysis revealed the presence of silver(I) chloride [green], and mixed cristobalite and magnesite [violet]. Cristobalite is a polymorph of silica that can form during the glass production at very high temperatures. The presence of cristobalite within corroded regions suggests a role in either initiating or accelerating corrosion of the mirrors reflective layer.
A versatile technique for analysing glass
Raman spectroscopy is a powerful non-destructive technique for looking into the chemical and structural composition of glass. The identification of materials below the surface, either within inclusions or internal interfaces is easily achieved and supplies insight into the history of a glassy material. Renishaw offers a wide range of Raman analysis solutions that are ideal for glass analysis, from transportable systems ideal for investigating ancient artifacts in situ, to research grade confocal Raman microscopes.
References
(1) http://www.historyofglass.com
(2) https://www.pilkington.com/en/us/architects-page/glass-information/the-chemistry-of-glass
(3) A. Kumar Yadav, P. Singh, “A review of the structures of oxide glasses by Raman spectroscopy” RSC Adv., 2015,5, 67583-67609
(4) http://www.mirrorhistory.com
(5) I. Martina, R. Wiesinger, D. Jembrih-Simbürger, M. Schreiner, “Micro-Raman Characterisation of silver corrosion products: Instrumental set up and reference database” e-PS, 2012, 9, 1-8
Further reading
We have a whole range or articles, case studies and news stories about Raman spectroscopy.
About the inVia microscope
Discover more about how the inVia confocal microscope is suitable for your organisations applications.