Al momento, questa pagina non è disponibile nella lingua scelta. È possibile visualizzare una traduzione automatica realizzata con Google Translate. Renishaw declina qualsiasi responsabilità relativa alla fornitura di tale servizio e specifica di non avere controllato la traduzione.
È possibile contattarci per richiedere ulteriore assistenza.
Photoluminescence spectroscopy and fluorescence explained
Renishaws spectrometers can perform photoluminescence (PL) spectroscopy to reveal the electronic structure of a material. Conversely, you can easily avoid unwanted fluorescence backgrounds during Raman analysis.
Photoluminescence (PL) is stimulated by the absorption of photons by a material. The material then emits light as it returns from an excited electronic state to its ground state. PL comprises both fluorescence and phosphorescence processes. The amount and type of PL depends on which material you are studying and which laser wavelength you are using.
When a sample is illuminated by a laser, both Raman scattering and photoluminescence (PL) can occur. Unwanted fluorescence backgrounds can prevent successful Raman analysis by obscuring the weaker Raman scattered light. We can often avoid high fluorescence backgrounds by choosing an appropriate laser wavelength.
What photoluminescence (PL) spectroscopy can tell us
In many, cases the photoluminescence (PL) spectrum can be useful. You can use the PL spectrum to study the electronic properties of materials. This is important for semiconductor analysis, where it reveals the band structure of the material and any defects. You can also analyse crystal defects in gemstones such as atomic vacancies and substitutions.
PL spectroscopy is non-destructive and can augment Raman data. Renishaws Raman systems are suitable for the analysis of both Raman scattering and PL.
You can use PL to study crystal defects, such as atomic vacancies and substitutions. This is important for gemstones such as diamond and semiconductor materials such as silicon carbide (SiC). Not only can you identify the type of defect, but you can also tell if the crystal has internal stresses.
How to measure a photoluminescence spectrum
To obtain a PL spectrum, we focus light onto a sample and measure the resulting luminescence. A PL spectrum is a plot of the emitted light intensity versus wavelength. With PL spectroscopy, we can study the electronic properties and the presence of defects in semiconductor materials. These studies often require a spectral range of hundreds of nanometers (or thousands of wavenumbers, cm-1). SynchroScan™ technology can also help to resolve both broad and sharp features in a PL spectrum.
Renishaw's spectrometers use a laser light source for PL spectroscopy. Lasers are monochromatic, so they provide intense illumination over a very narrow wavelength range. As a result, laser excitation can reveal PL peaks that might not be visible with other excitation sources such as UV lamps or tunable spectrofluorometers. The amount and type of PL depends on which material you are studying and which laser wavelength you are using. To stimulate PL, the incident light must have a higher energy then the electronic band gap of the material. A lower energy corresponds to a longer wavelength. Therefore, we observe PL emission at wavelengths longer than that of the incident light.

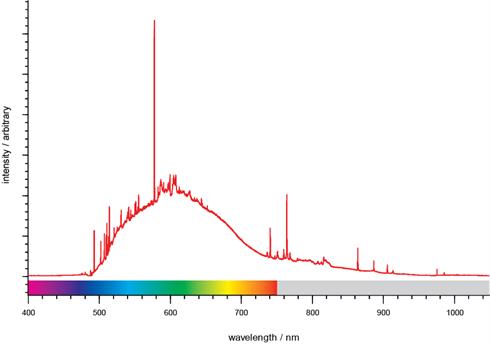
Broadband spectrum of SiC, showing PL features. The spectral range is from 400 nm to beyond 1000 nm, across the visible and beyond. Data courtesy of Prof. John Steeds and Dr. Geraint Evans, Dept of Physics, University of Bristol, UK.
Fluorescence and phosphorescence
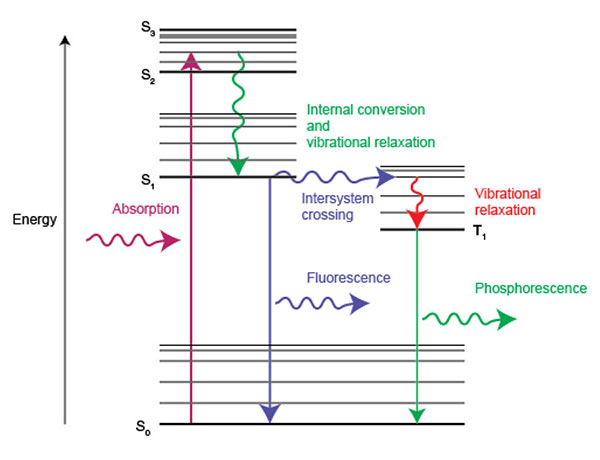
Photoluminescence includes fluorescence and phosphorescence processes. Generally, fluorescence refers to PL that is almost instantaneous and lasts less than 10 nanoseconds. On the other hand, phosphorescence refers to PL that lasts longer than 10 nanoseconds after removal of the incident light. The Jablonski diagram below helps us to understand the quantum mechanics behind fluorescence and phosphorescence.
We consider a molecule in its singlet ground state (S0). In the case of fluorescence, the molecule absorbs a photon which promotes it to a singlet excited state (S1). Fluorescent emission of light occurs when the molecule relaxes from S1 to S0. Both S1 and S0 states have the same spin multiplicity, so the transition from S1 to S0 is allowed. This is why fluorescence occurs in less than 10 nanoseconds.
For phosphorescence to occur, the molecule typically contains atoms with higher mass and a high degree of spin-orbit coupling. This increases the probability of intersystem crossing (ISC) between singlet S1 and triplet T1 electronic states. Due to the conservation of angular momentum, the relaxation from T1 to the S0 ground state is forbidden because these electronic states have different spin multiplicity. Once again, spin-orbit coupling relaxes this rule so phosphorescence can occur as a radiative transition from the T1 to the S0 state. This is why phosphorescence occurs on a much slower timescale (microseconds to thousands of seconds) than fluorescence.
In brief, fluorescence occurs when a molecule emits light from its first excited singlet state S1, after the absorption of a photon. Phosphorescence occurs when a molecule emits light from its triplet state T1 after intersystem crossing from S1.
 Energy diagram showing absorption of light and the processes involved in the emission of light as fluorescence and phosphorescence.
eBook download: Raman spectroscopy explained
- What is the Raman effect?
- What is Raman spectroscopy?
- What can Raman imaging show you?
- Advantages of Raman spectroscopy
- Parts of a Raman spectrometer
- Photoluminescence explained
Fluorescence imaging and FLIM
Biologists often use fluorescence imaging. This involves treating biological tissues and cells with fluorescent tags or labels to detect the presence and distribution of molecular species. Renishaw's inVia™ confocal microscope and RA816 Biological analyser are ideal for generating images of fluorescent tags as biological markers. However, this approach is more invasive than Raman analysis, which is typically label-free.
In contrast, fluorescence lifetime imaging microscopy (FLIM) is a label-free technique for studying the molecular environment of biological cells and tissues. This complements Raman spectroscopy which reveals the underlying biochemistry. The inVia microscope can now be equipped with integrated FLIM capability for label-free multimodal imaging.

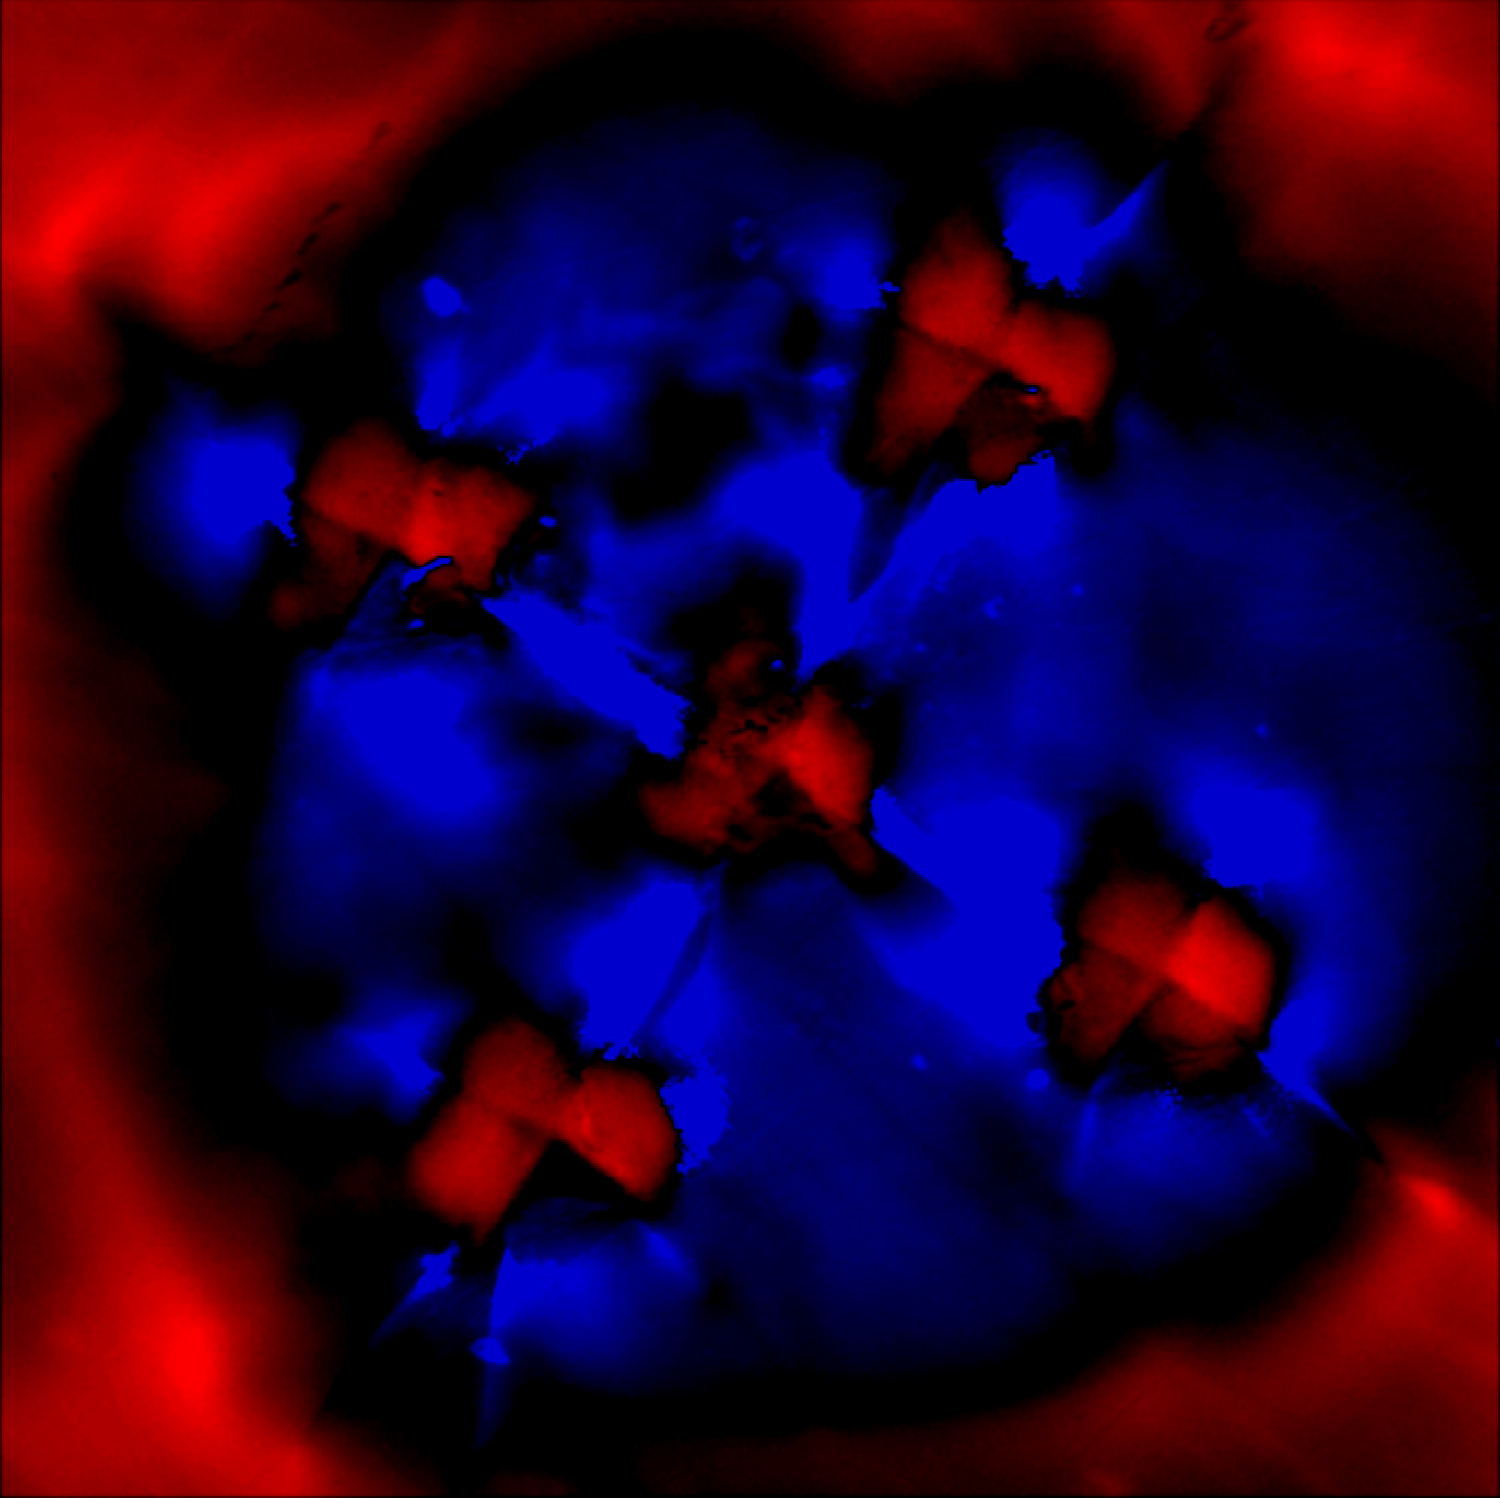
Stress image generated from the ruby R2 PL band position.
Comparing Raman and PL spectroscopy
Spectrometers collect Raman and photoluminescence emissions at the same time. How do we differentiate between the two?
A material emits PL bands at constant wavelengths, and these depend on its electronic structure. The absorption and luminescence bands of the material do not change even if we use a different excitation wavelength. By convention, gemmologists report PL peaks in nanometres (nm). Physicists working on semiconductors prefer to report PL peaks in electronvolts (eV).
In contrast, Raman bands have a constant energy difference relative to the excitation wavelength. Raman spectroscopy measures the change in energy when light interacts with molecular vibrational energy levels. In Raman spectra, the reported x-axis values are relative to the excitation source. Hence, we label the x-axis as Raman shift with wavenumber units of cm–1.
How to avoid fluorescence backgrounds in Raman spectra
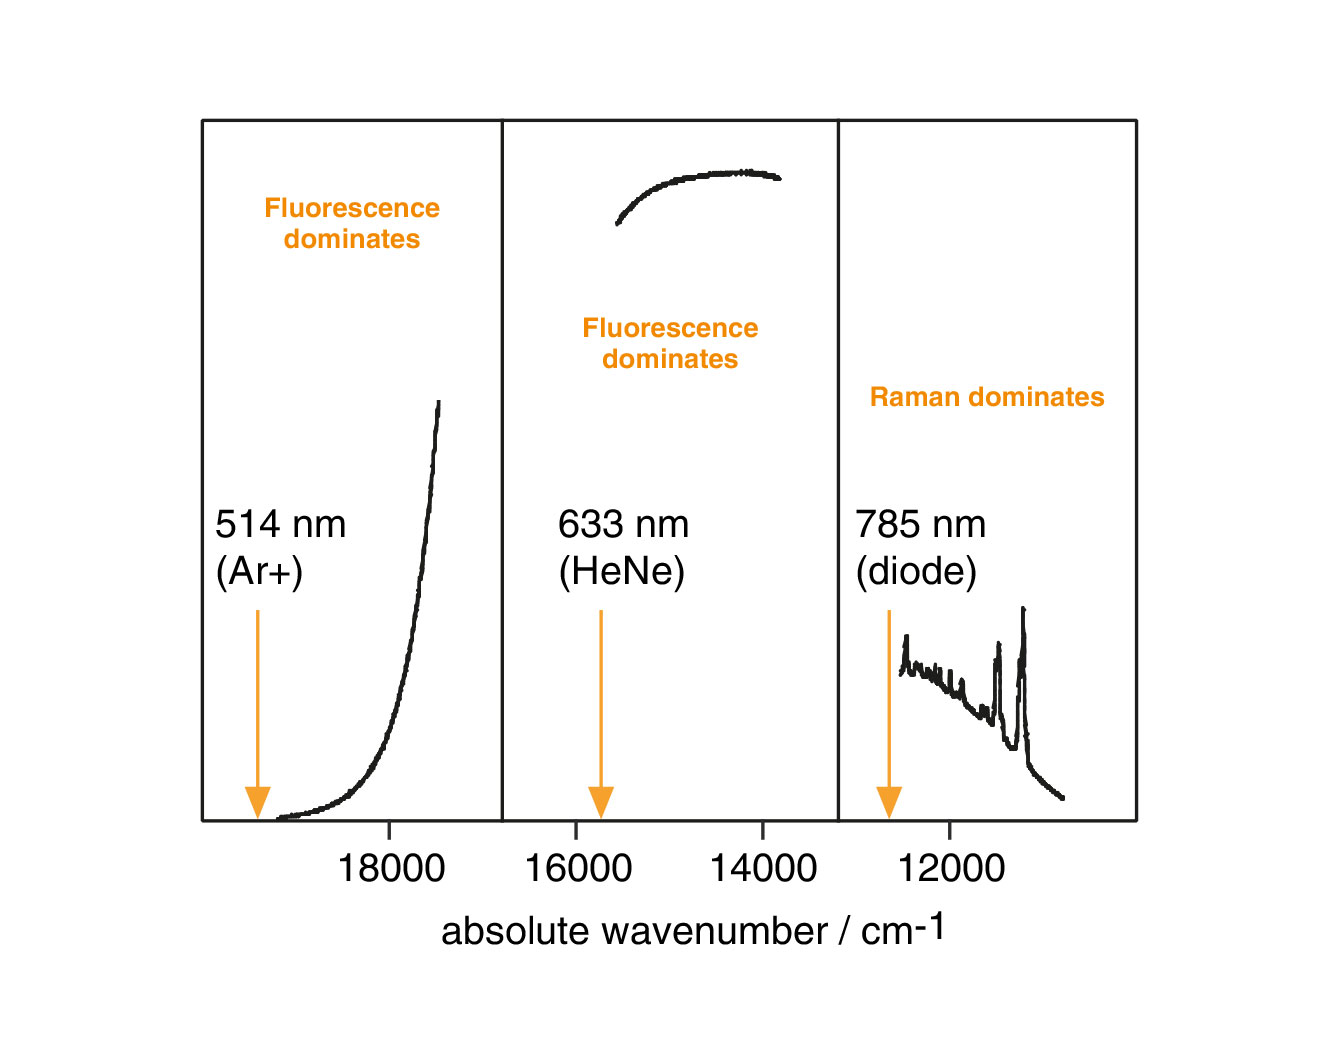
When we illuminate a sample with a laser, both Raman scattering and photoluminescence (PL) can occur. Fluorescence emissions can be much more intense than Raman scattering and can prevent successful Raman analysis. You can avoid this by using a different laser wavelength. This can move the Raman bands away from the most intense PL emission and may even avoid the generation of PL entirely.
A good Raman instrument should be able to switch easily between different laser wavelengths. You can then select or avoid PL features, depending on your requirements.

Spectra from a conducting polymer. We can clearly observe Raman bands when using near infrared laser excitation at 785 nm. When we illuminate the sample with a visible laser at 514 nm or 633 nm, strong fluorescence backgrounds dominate the spectra. We have scaled the vertical axes for clarity.
What is Raman spectroscopy?
Continue your exploration of Raman and photoluminescence (PL) spectroscopy. We answer your questions on Raman microscopy, fast Raman imaging, data analysis, fluorescence and complementary analytical techniques.
Raman spectroscopy explained