Detecting doctored documents - how Raman spectroscopy can help identify forged documents
In this ever-progressing age of technological advancement more and more we witness the old remnants of technologies recede into history. It now appears, in the advent of the modern era, print is endangered. Personal computers with access to the internet now permeate the daily life of people across the world offering easy access to literature that only decades before would have required printing. Your very reading of this article enforces the point.
Understandably, advancements in the way we access and handle information has led many people to even question the future validity of the ultimate written medium - old-fashioned pen and paper. Though where print media is stubbornly falling to alternatives, writing persists as the most convenient and accessible way of conveying information. We can safely say pen and paper will be sticking around for a few years yet.
This does present some interesting challenges however, notably, when it comes to the validation of written works. A prime example presents itself within the realm of legal documentation - contracts and agreements. Despite the growth of e-commerce, the norm for signing legal documents remains a handwritten signature on paper. Moreover, authenticated documents are required to be signed before a notary public, all seals must be originals, all certifications must match. How then, do we go about validating these documents, how can we ensure a signature is original? Unlike electronic documents there are no methods of tracking contributors or alterations. What if an entrepreneurial rogue changes an initial on a mortgage agreement, or adds an additional zero on the cheque they received? It is vitally important that we can determine the authenticity of writing for these reasons. The answer to this challenge comes in one elegant form, spectroscopic Raman analysis. One of the world's leading instruments in this field being Renshaw's inVia™ confocal Raman microscope.
Crossing ink analysis
A technique is required to determine ink composition to establish if a document contains changes made with different pens. There are many different types of inks; colours may be the same, but chemically they can be different. Raman analysis allows for rapid, non-destructive testing of questioned areas with the specificity to distinguish similar ink types that may visually look identical. Recently Renishaw has been taking this investigation further and exploring how to determine the crossing order of two ink lines originating from different pens. Traditionally this has been a difficult challenge to approach; the inconsistent background of paper and the requirement to interpret chemical images introduce large degrees of uncertainty. How then, can the inVia reliably determine the origin of additional ink lines on paper?
Renishaw has developed a new method to measure the ink order through the implementation of several techniques exclusive to Renishaw's systems. The premise lies in the analysis of each ink's coverage within the region where they cross. The crossing region is a mixture of both ink components, logically, the uppermost ink appears in the largest quantity when analysing using a laser impinging on the top surface. This is revealed using false colour images and concentration estimation techniques.
Method
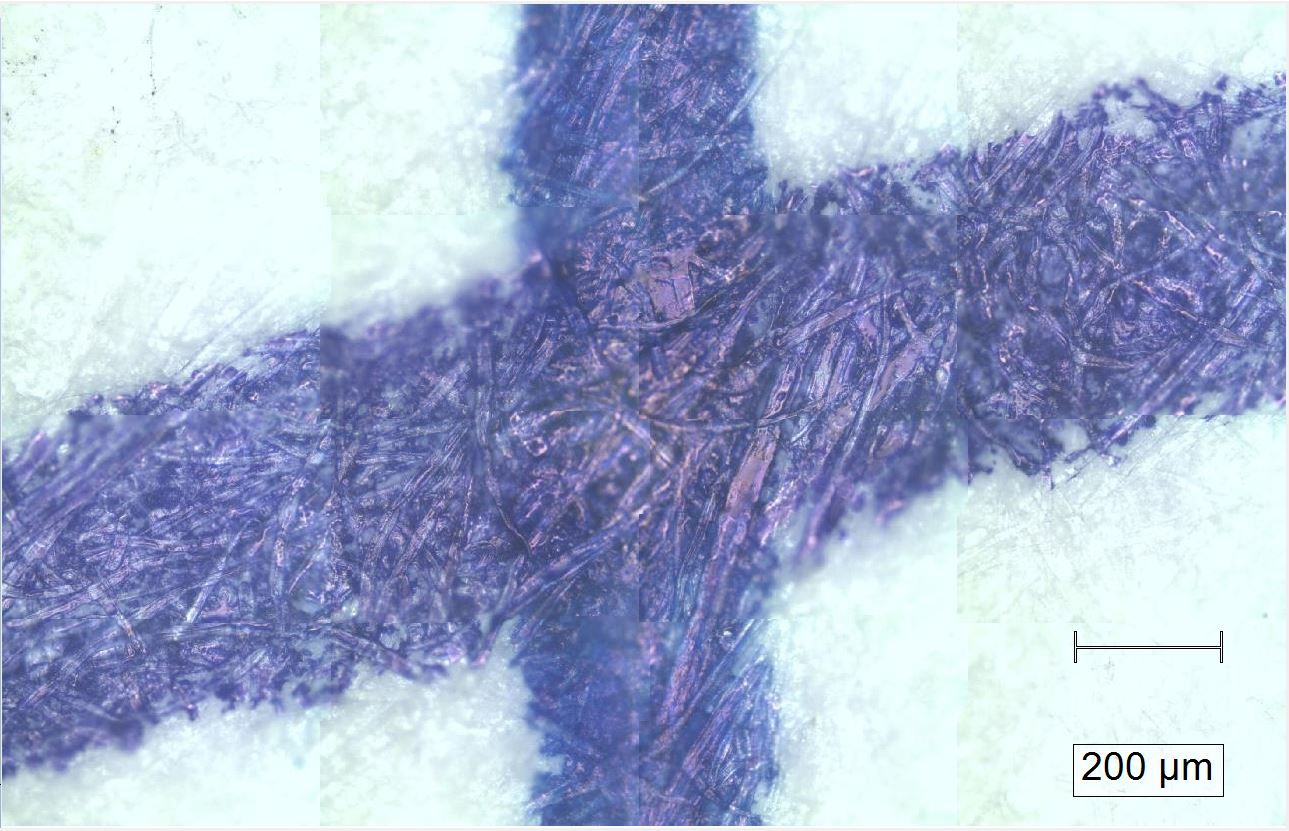
The process begins by capturing a white light image of the crossing region and surrounding area. To capture the composition of the crossing region, the area is scanned using StreamLine™ chemical imaging. This collects spectral information from the inks with a continually moving line-focused laser. The line focus has a lower power density than a traditional spot focus which allows for a greater laser power without damaging the ink layer. Once the data is gathered, distinct regions of the image are masked and pure references for each ink are obtained. The Masking Tool is available as part of Renishaw's WiRE software and is used to limit the data to be processed as defined by the thresholding of an image (e.g. white light or Raman) or by manual selection of an area of the scan.

White light image of ink crossing. The region between the two lines defines the crossing. The uncrossed ink sections were masked and pure references were obtained for component analysis.
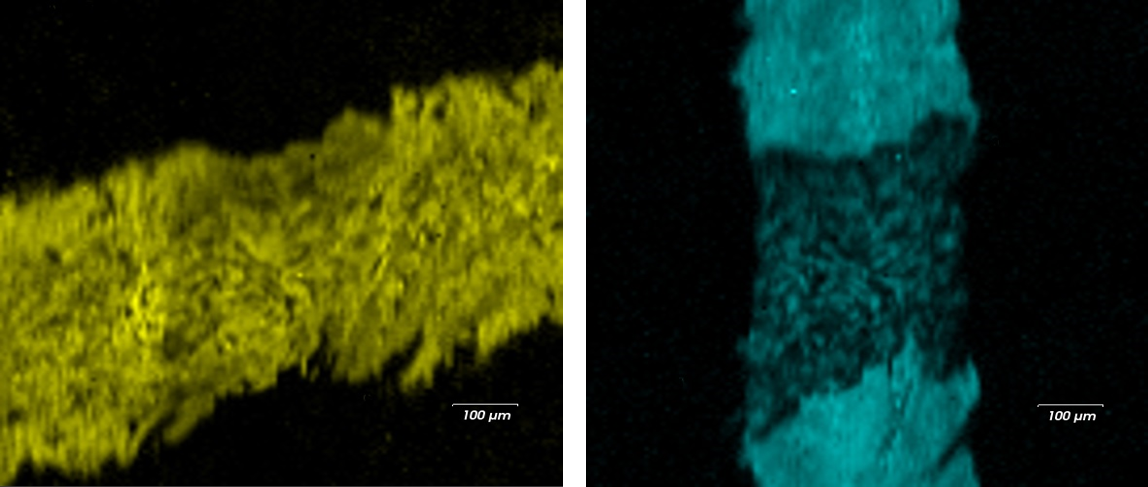
Now that we have a reference for each ink, component analysis can be performed to obtain false colour images that display the distribution of each component on top of the white light image. Previously at this stage, the user attempting to identify the crossing order would threshold the false colour image and establish the crossing order. As darker areas indicate less similarity to the reference, the darker ink image in the crossing region was assumed to be on the bottom layer, however, there was no guarantee two independent users would threshold the image the same way and arrive at the same conclusion. Depending on the image, the ink order can potentially be interpreted either way. So, how can we alleviate this previously encountered pitfall? The answer, of course, lies in another exclusive investigative tool... introducing Concentration Estimates.

False colour Raman images of the two different pen strokes. These images demonstrate the chemical specificity of Raman spectroscopy, ink species are identified and relative concentrations of each ink can be determined.
The Concentration Estimates tool determines the total percentage contribution from each ink based on the component analysis generated image. The process doesn't account for any changes to the image thresholds, therefore ensuring highly consistent results from user to user. The larger concentration estimate value corresponds to the ink that is more prevalent in the crossing area being analysed. The larger the concentration estimation difference between the two references the more confidence we can have in the deposition order.
Similarly, the concentration estimate of the pure regions indicates the high specificity between the references. In this way, we have a statistically meaningful value to provide confidence in our determination of the ink deposition order.

This table displays the concentration estimate value of each ink at the pure ink and crossing regions. The pure regions confirm the chemical specificity of the technique. The large difference in concentration at the crossing gives confidence in the proposed deposition order.
And there you have it; you now know how disputes of forgery or altercation are spectrographically analysed and resolved with the help of Renishaw's InVia Raman microscope.We hope you can continue to sign off legal documents care-free, until a new standard in document authentication sweeps across the world that is. We will tackle that challenge when it comes, with the same precision and enthusiasm we pursue across our entire range of applications.
About the author
Lewis Mitchell, Applications Scientist

Lewis graduated Heriot Watt university with a MSc in chemical physics and is now taking his first steps into the world of Raman spectroscopy. At university Lewis began his time in academia working with metasurfaces. In later years he participated in the application of Bessel beams in material welding with later focus on non-traditional welding mediums. To round off his education, in his final year he researched at the university's ultra-fast molecular dynamics lab and this is where his passion for spectroscopy flourished.
At Renishaw, Lewis works on cutting edge applications including the development of new hardware and software with recent work involving auto-focus tracking, univariate stage movement and averaged imaging techniques.