Denna sida finns för närvarande inte på ditt språk. Du kan
översätta
den automatiskt
med Google Translate. Vi ansvarar inte för att tillhandahålla denna tjänst och
vi har inte kontrollerat översättningsresultaten.
Kontakta oss om du behöver ytterligare hjälp.
Raman spectroscopy webinars
Learn more about Raman
Join us for one of our upcoming webinars where you can gain valuable insights from our worldwide team of applications scientists.
Want to stay up to date with new upcoming events?
Our live webinars typically last for around one hour including a question and answer session with our expert panel. All of our webinars will be made available to watch on demand shortly after.
Webinars: on demand
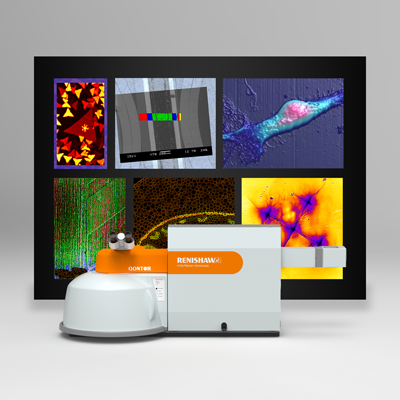
To gain full sample characterisation, you can combine Raman microscopy with multiple analytical techniques. In this webinar, we discuss how correlative Raman spectroscopy can be used in multi-modal analysis. Raman analysis provides chemical and structural information, while being non-destructive and requiring very little sample preparation. Discover the importance of perovskites as a solar cell material, with key application context.

Raman spectrometers can be equipped with a wide range of laser sources, emitting at different wavelengths. Our Applications Manager, Tim Smith and Sales and Applications Scientist, Jerome Innocent, will dive deep into why choosing the right laser for your Raman analysis matters.
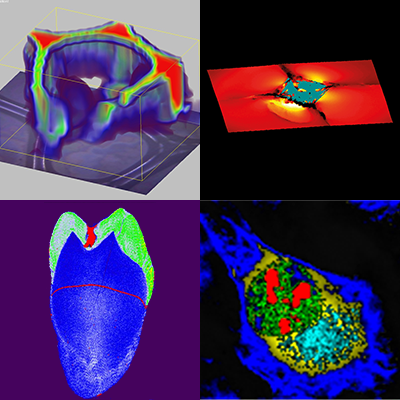
Raman imaging can provide insight into variations in chemical composition, material stress and strain and defects within a sample. This can be applied to many samples from semiconductors and minerals, to pharmaceuticals and biological specimens. In this webinar, we will explore fast Raman imaging for various real-world applications.
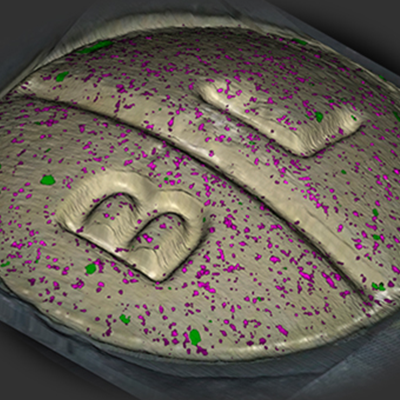
In collaboration with Malvern Panalytical, we discuss the technologies used to measure the particle size of powders and the domain size of tablets. We also explore how these measrements can be used to inform tablet performance criteria.
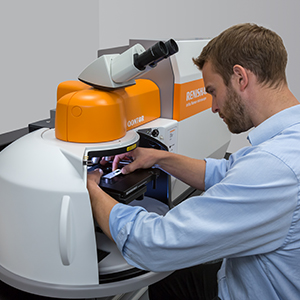
Raman microscopy is a powerful analytical technique for studying the chemistry and structure of materials. You can use Raman spectroscopy to understand most materials, but how do you do this? In this webinar, you will learn how to collect high-quality Raman data. We will discuss different measurement settings and how to optimise them for your samples.

Learn how to analyse different biological sample types, including, cells, tissues, and fluids. We will show you how to optimise Raman data collection and analysis for different biological samples, choose the best substrate for your work, select the optimum laser wavelength and objective lens, process and analyse your data with classification models, and generate high-resolution Raman images.

Luca Maurizi, from Aalborg University, Denmark, presents sampling and analytical methodology for microplastic identification in drinking water collected from a water treatment plant and analysed using a Renishaw inVia™ confocal Raman microscope.
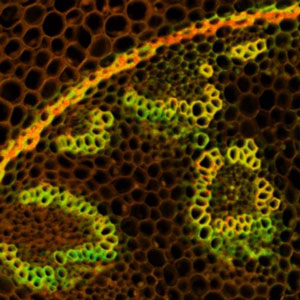
In this webinar, we will describe how we have integrated FLIM hardware, developed by Becker & Hickl, onto a Renishaw inVia Raman microscope. Both techniques employ the same optical arrangement and mapping stage hardware. This means that FLIM and Raman data can be collected from the same sample area with pixel-to-pixel accuracy.
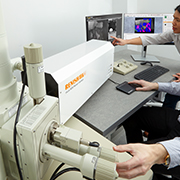
The inLux SEM Raman interface enables scanning electron microscopes to access essential information on molecular chemistry and structure with Raman imaging. Our scientists demonstrate how the inLux interface simultaneously collects co-localised Raman spectra and SEM images to give precisely located chemical and structural analysis.
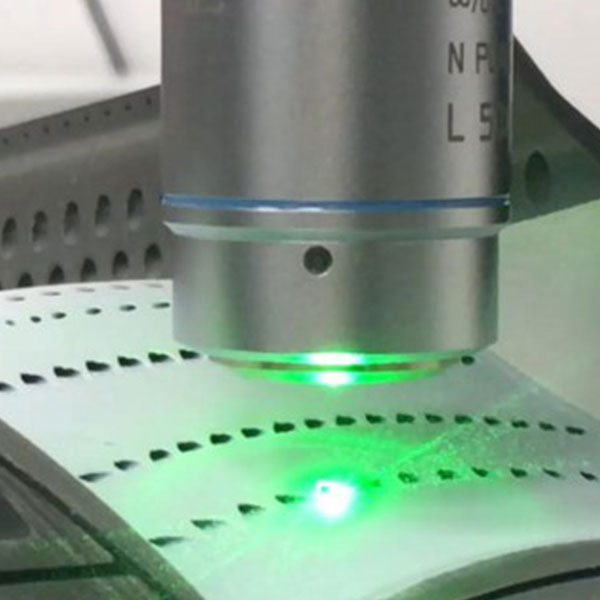
Maintaining sharp focus is critical to the collection of high-quality Raman data from uneven or dynamically changing surfaces. In this webinar we demonstrate how to obtain Raman images from complex surfaces.

You can use Raman spectra to differentiate between the different forms of carbon. See how the G, D, 2D and T bands of carbon can reveal crystallinity, defects, layer structures and sp2/sp3 hybridisation.
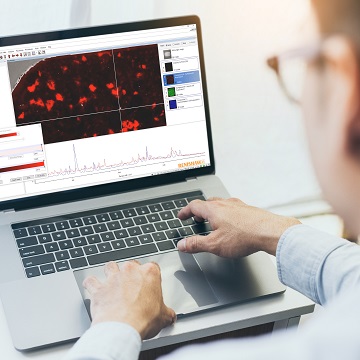
Raman data contains a wealth of information. Well-chosen processing and analysis methods ensure results are consistent and reliable. In this webinar we will show data processing options such as cosmic ray removal, baseline correction and data truncation.
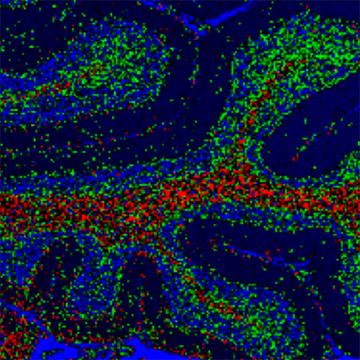
Raman spectroscopy has become a key analysis technique within medicine. It can retrieve detailed chemical information from samples in their endogenous, unaltered form. This makes Raman an effective method for assessing disease state within biofluids and tissues.
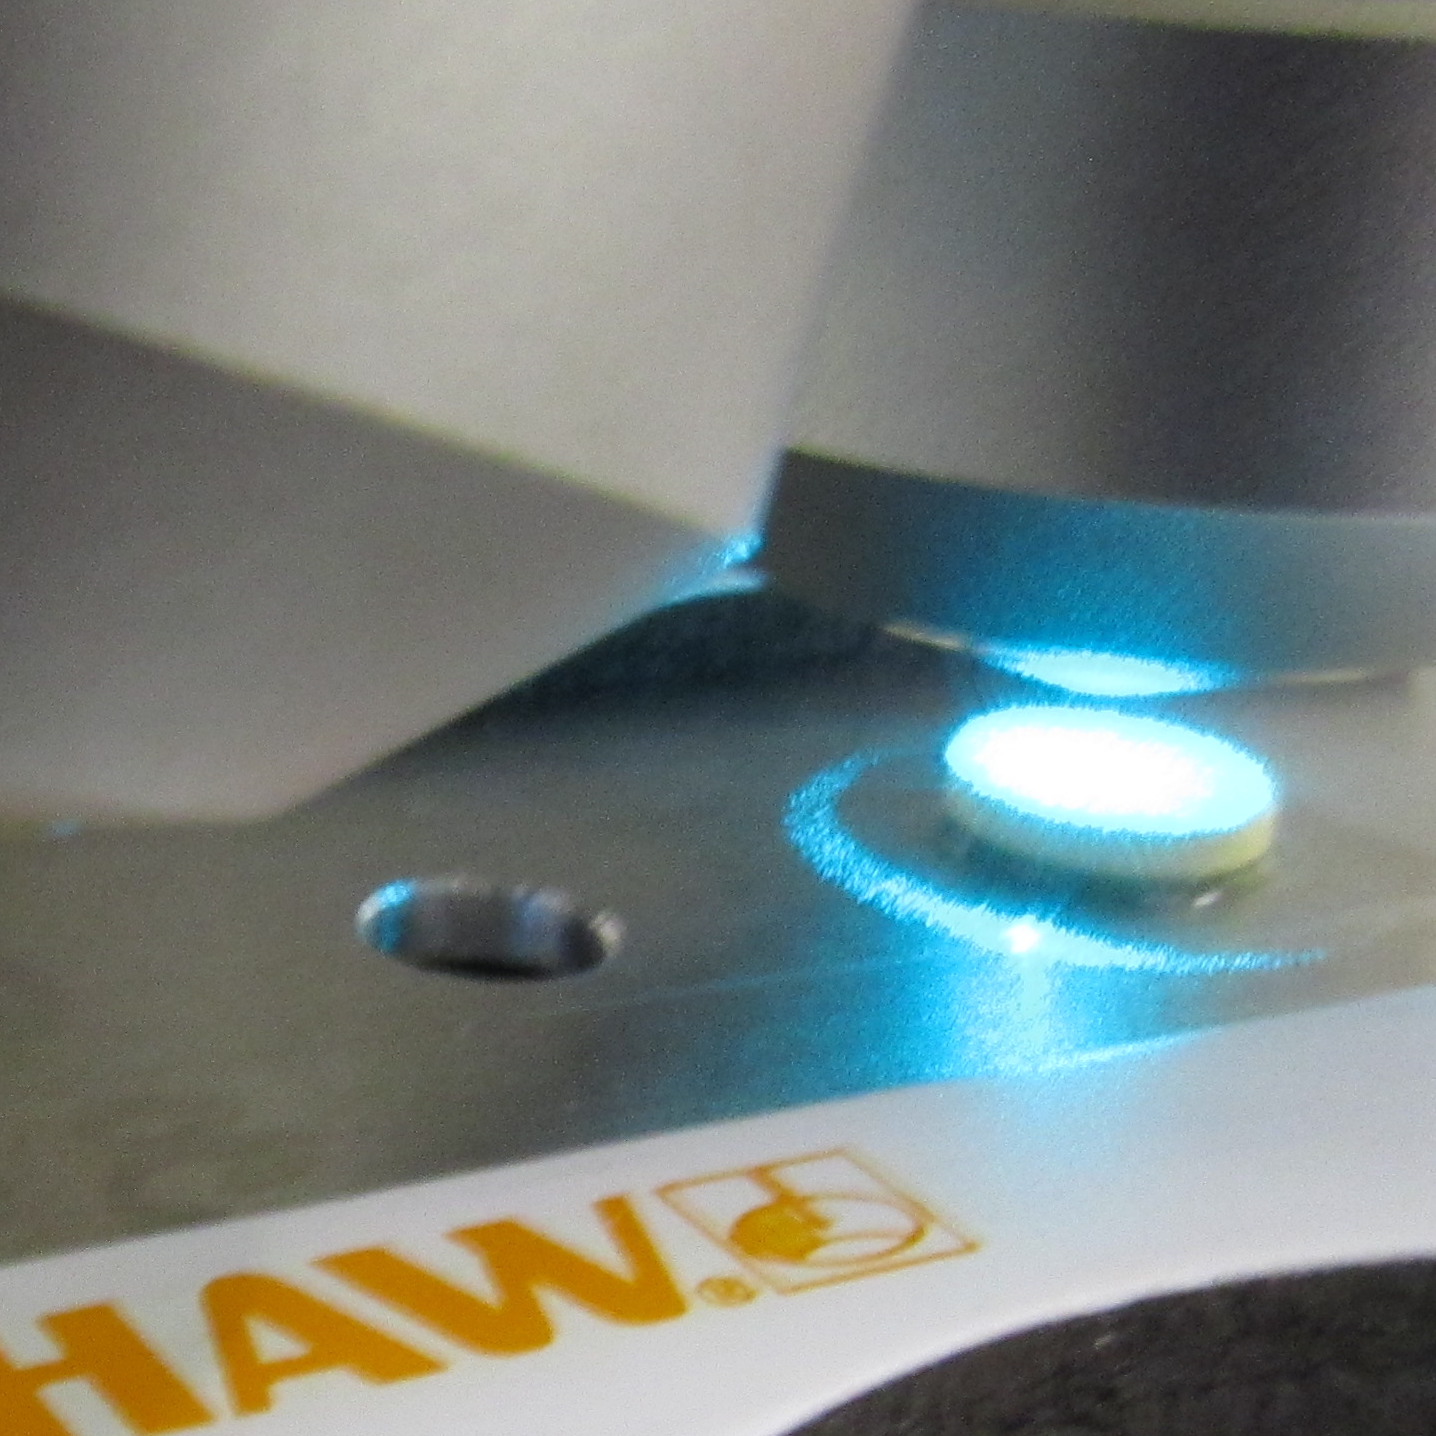
Designed to help you choose the best instrument configuration when buying a new Raman spectrometer; the first part of our three-part webinar series covers the different types of lasers available to help you achieve the quality of data required for your specific needs. We will be taking an in-depth look at excitation wavelength, power and focus type, to give you the confidence and knowledge so that you can make the right choice when purchasing.
In the second of our three-part series, we discuss the key aspects of a spectrometer that affect the quality of your Raman data, including performance, detectors, filters and optical configuration.
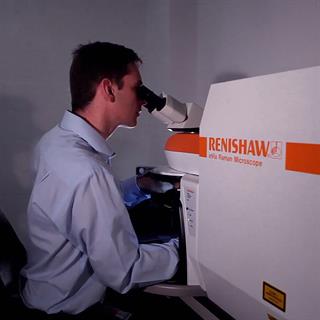
Building on the topics covered in the first two webinars, we will demonstrate what we have discussed using an inVia confocal Raman microscope, and illustrate various topics including; instrument configuration, switching between lasers and the effect it has on spectra, how objective lenses affect the results, and how single measurements can be extended to give maps/images and reveal spatial information.
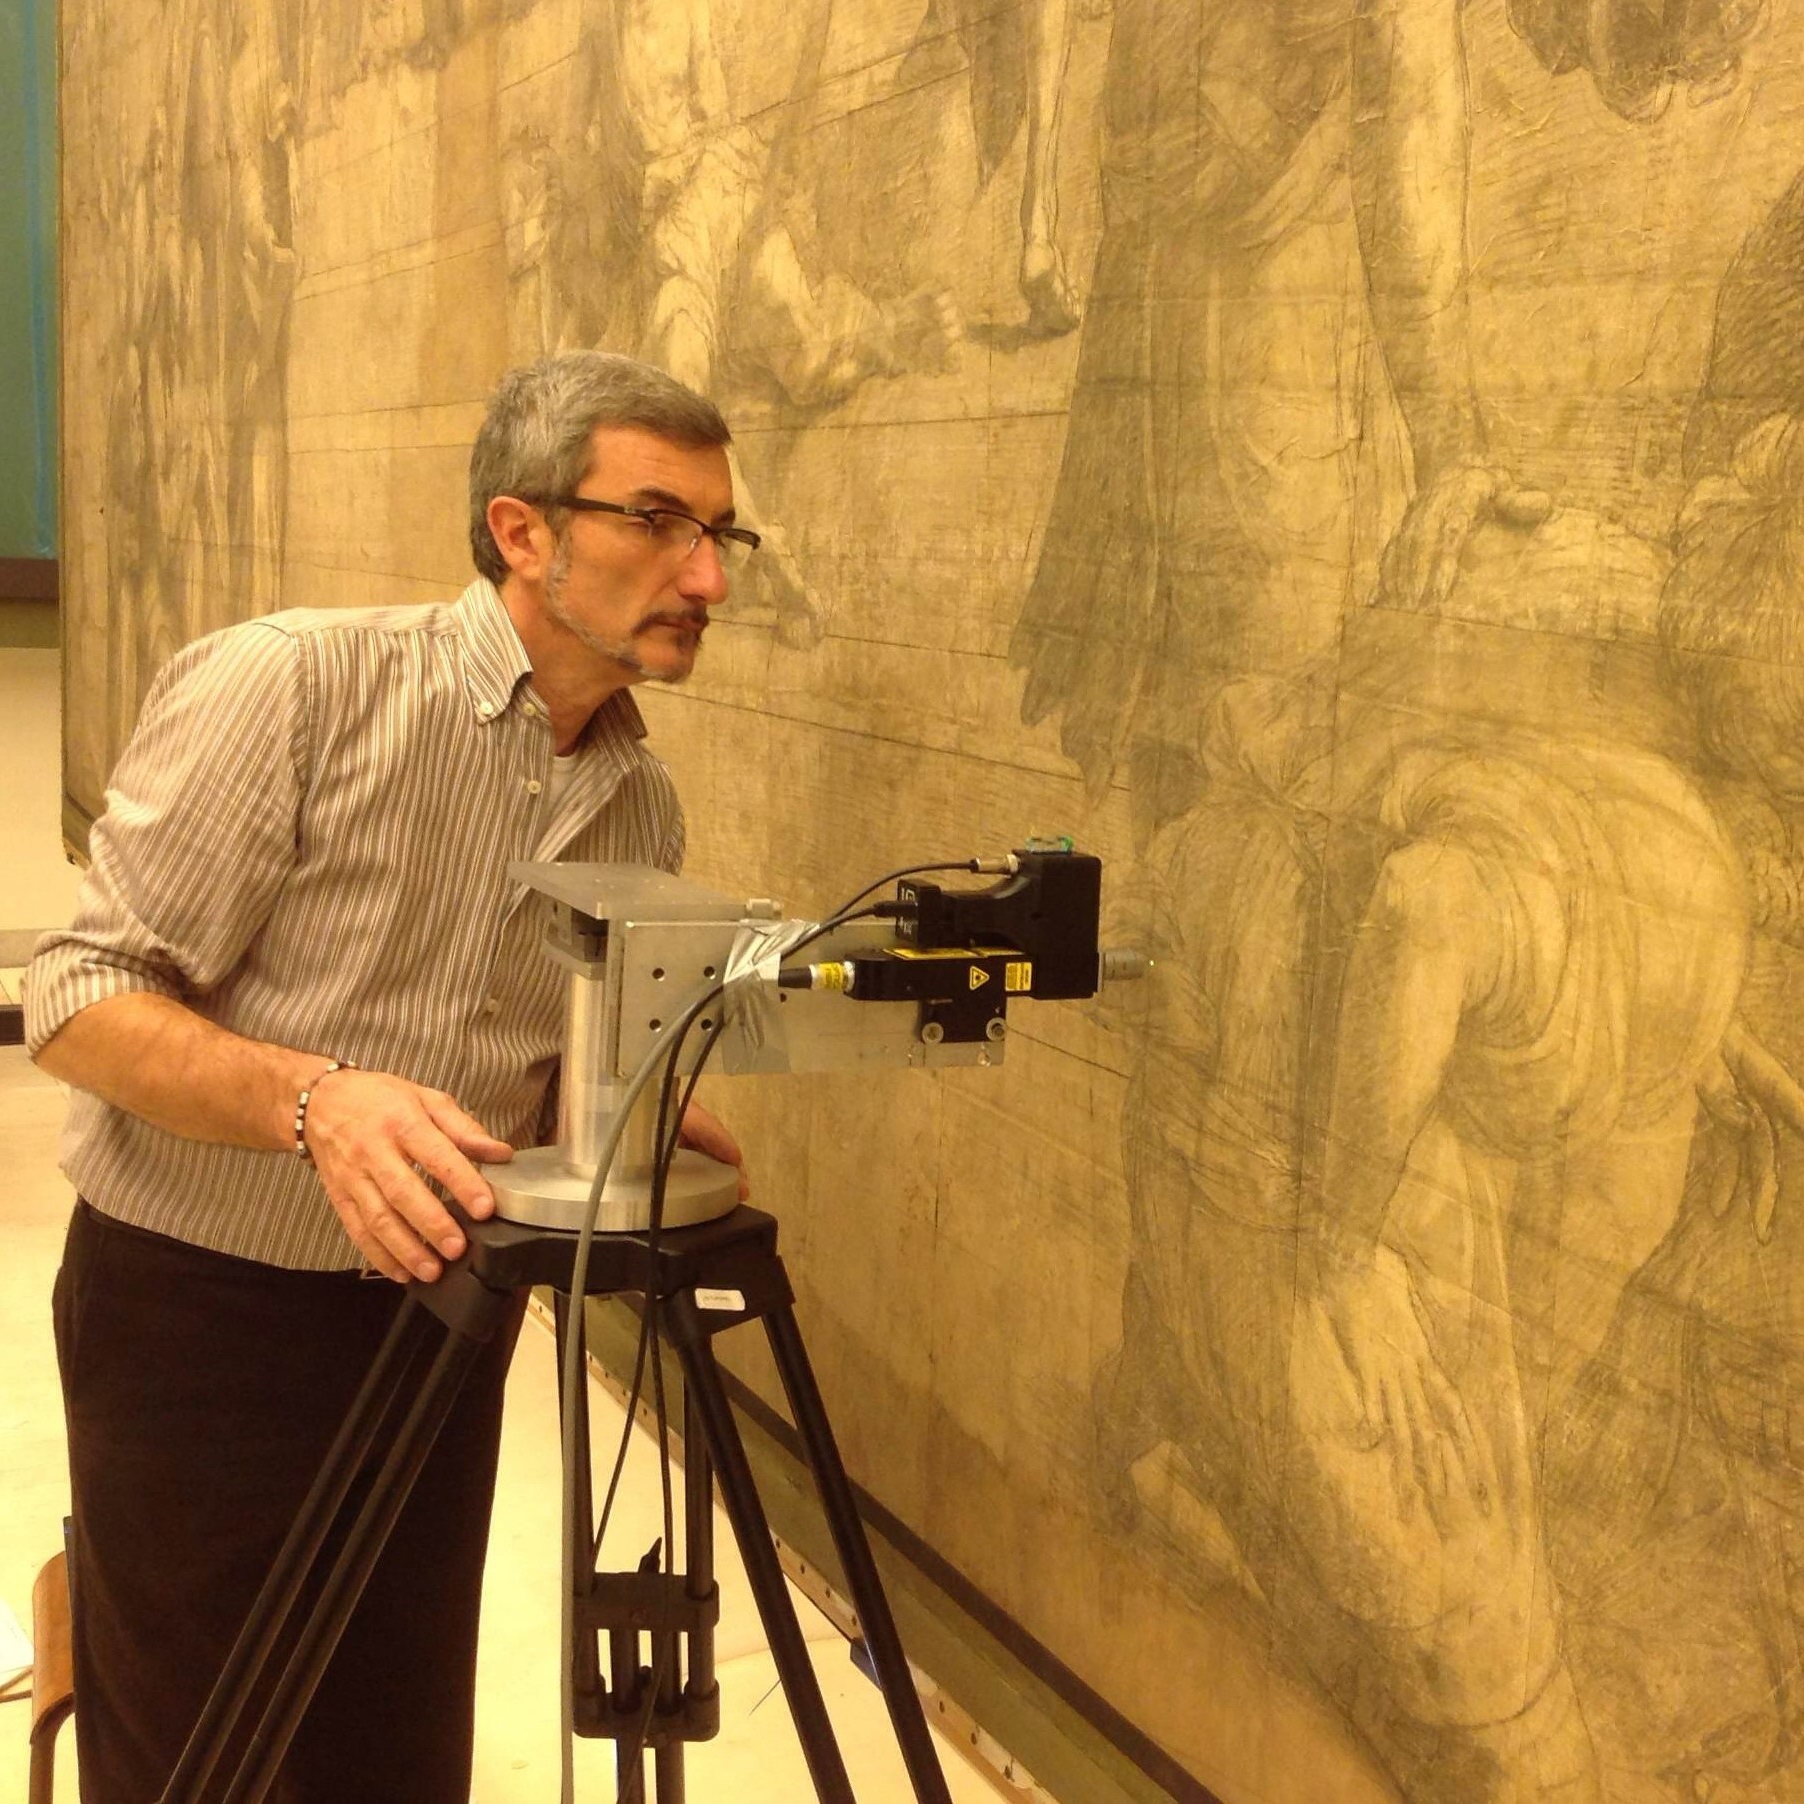
In this webinar we will show you how to collect and process Raman spectroscopy data and give examples of how it has provided key information in cultural heritage studies. You will see how the latest advances in Renishaw's technology can be used to study samples ranging from microscopic fragments to large artefacts with complex shapes.
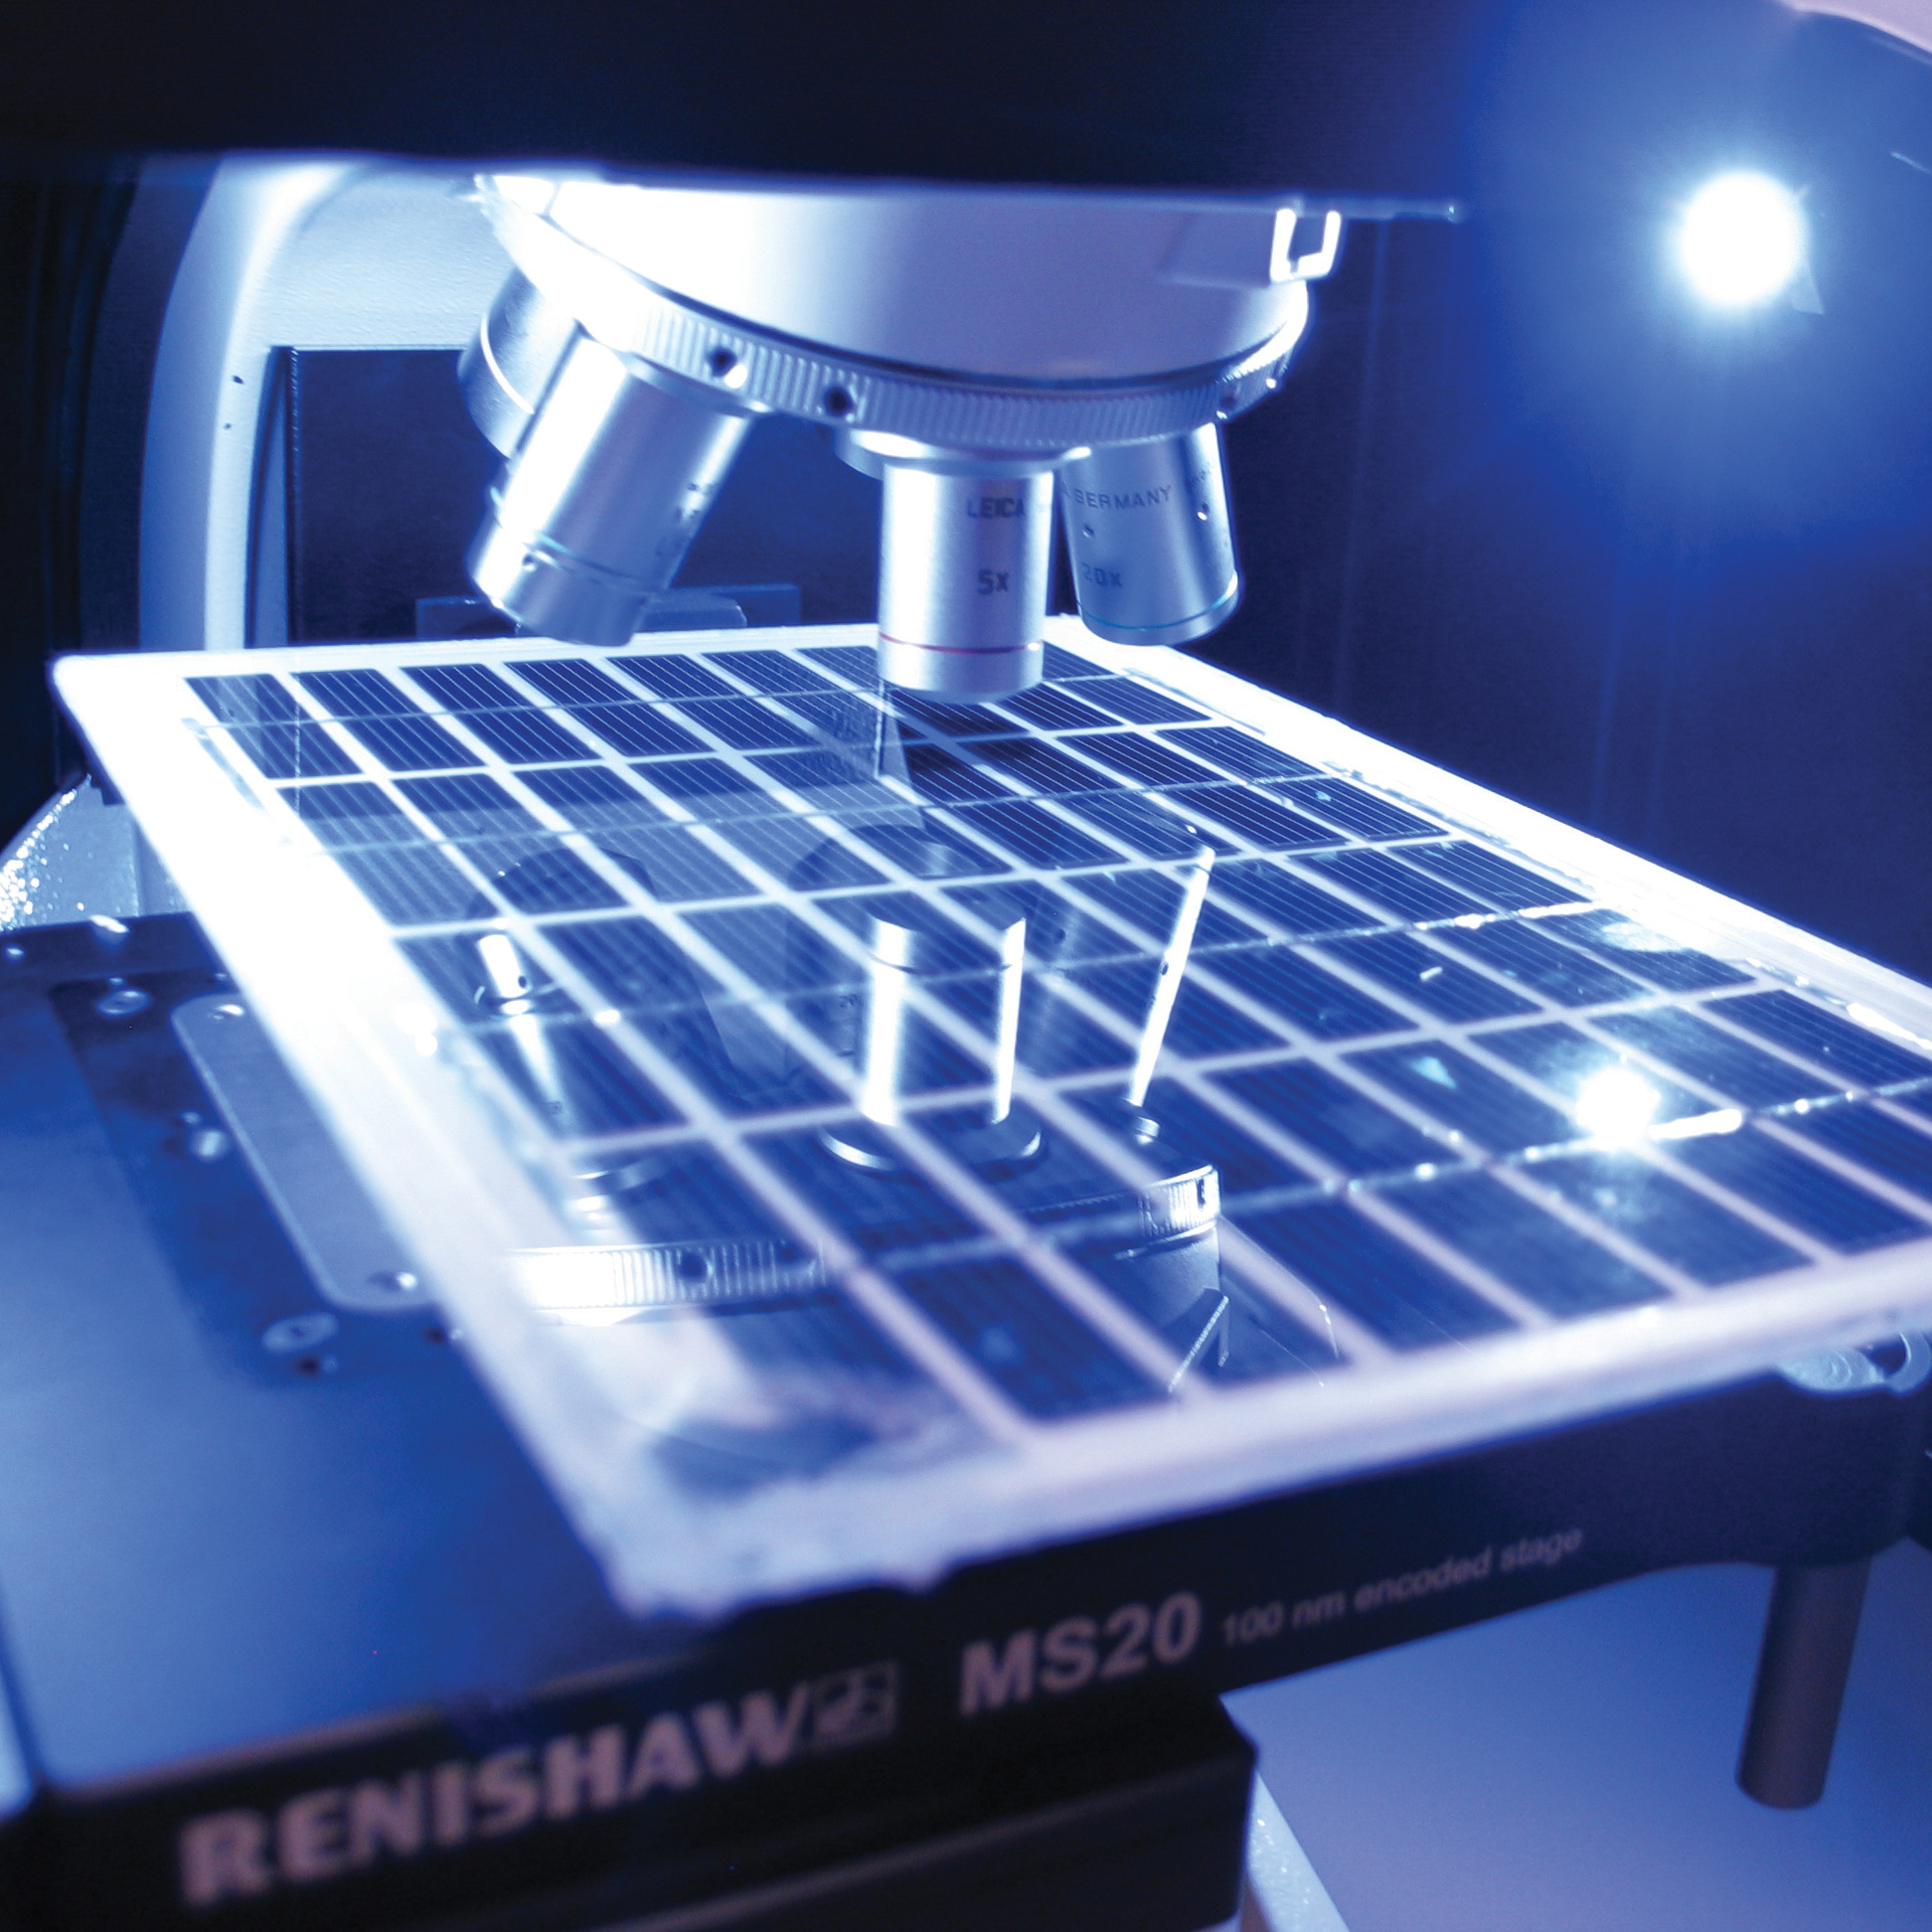
The green energy revolution is progressing rapidly, and researchers are developing many novel materials to support it. In this webinar we show how you can characterise such materials in all phases of development with Raman spectroscopy. Examples discussed include lithium-ion batteries, LEDs, and poly-crystalline silicon and perovskite solar cells.

We discuss the classification methods you can use to distinguish similar materials and show how Renishaw’s Data Classifier software has the potential to diagnose diseased brain tissue and can distinguish between real and fake whiskies. We also show how you can build classification models and quantify sensitivity and specificity.
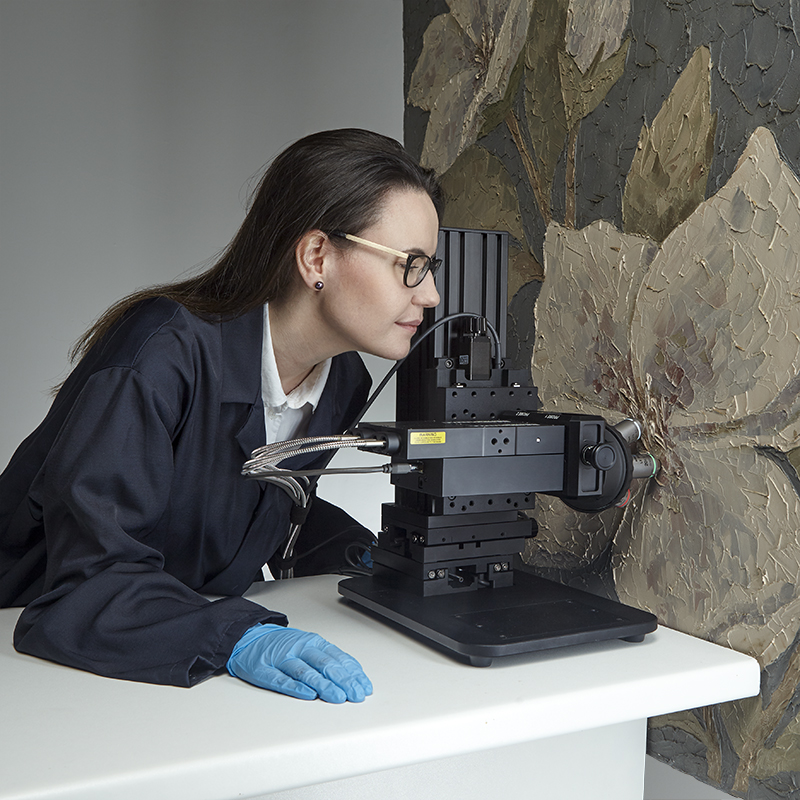
Learn how you can acquire Raman spectra from samples that are impossible to analyse with a conventional microscope. Large, irregular, and dynamic samples are studied using the Renishaw Virsa analyser. These include engineered components, 2D-materials and systems undergoing change. Examples include coated gas turbine blades, works of art, and melting polymers.
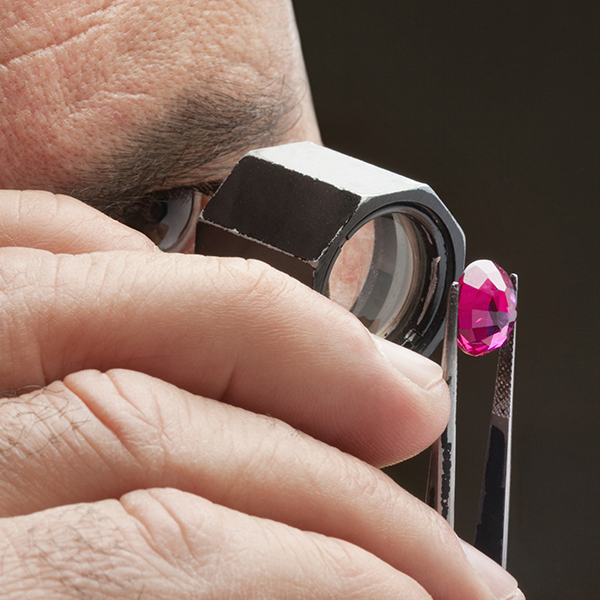
For a long time, the eyes of the gemmologist and a microscope were the only tools needed in a gemmological laboratory. However, technological improvements have led to a new range of artificially treated natural stones and to synthetic gems that the eye and microscope cannot distinguish. Today's gemmological laboratories need to have instruments and skills that rival university research centres.
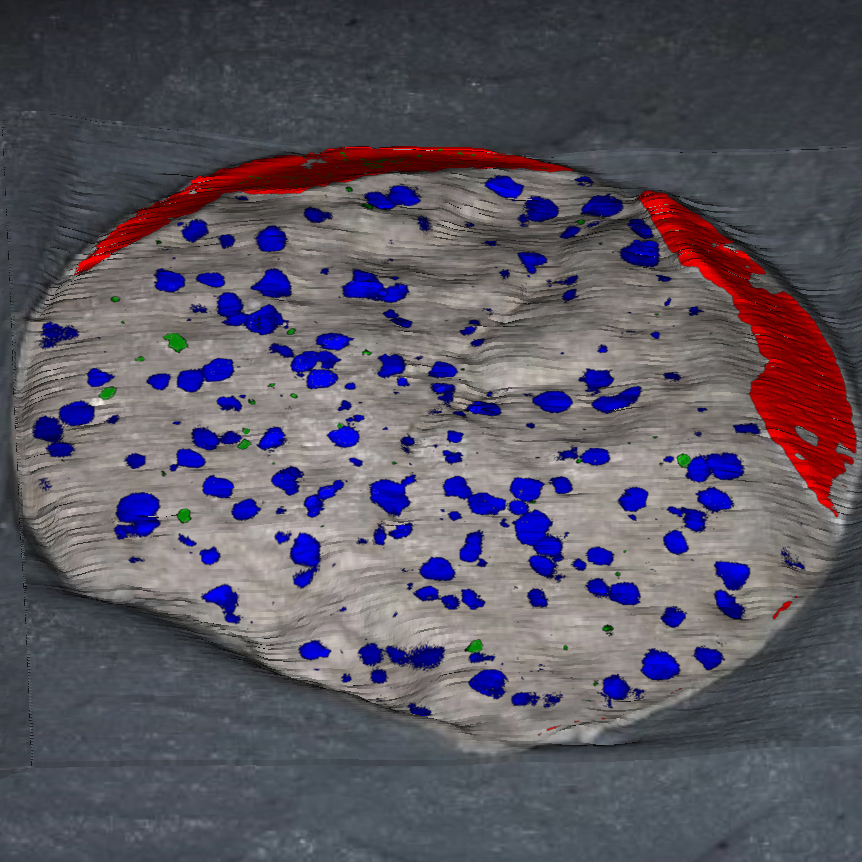
In this webinar, we discuss data collection and processing methodologies that ensure robust and accurate reporting. Using pharmaceutical materials as examples, we show how to produce statistically meaningful results. From PLS of Transmission Raman data to quantification of tablet images, find out everything you need to know to perform successful quantitative Raman analysis.

In this webinar we describe the many applications of Raman spectroscopy in polymers and plastics; from production to disposal. We will be looking at complex laminar structures in packaging materials and understanding types microplastic pollution. Join us for the event followed by a live Q&A.
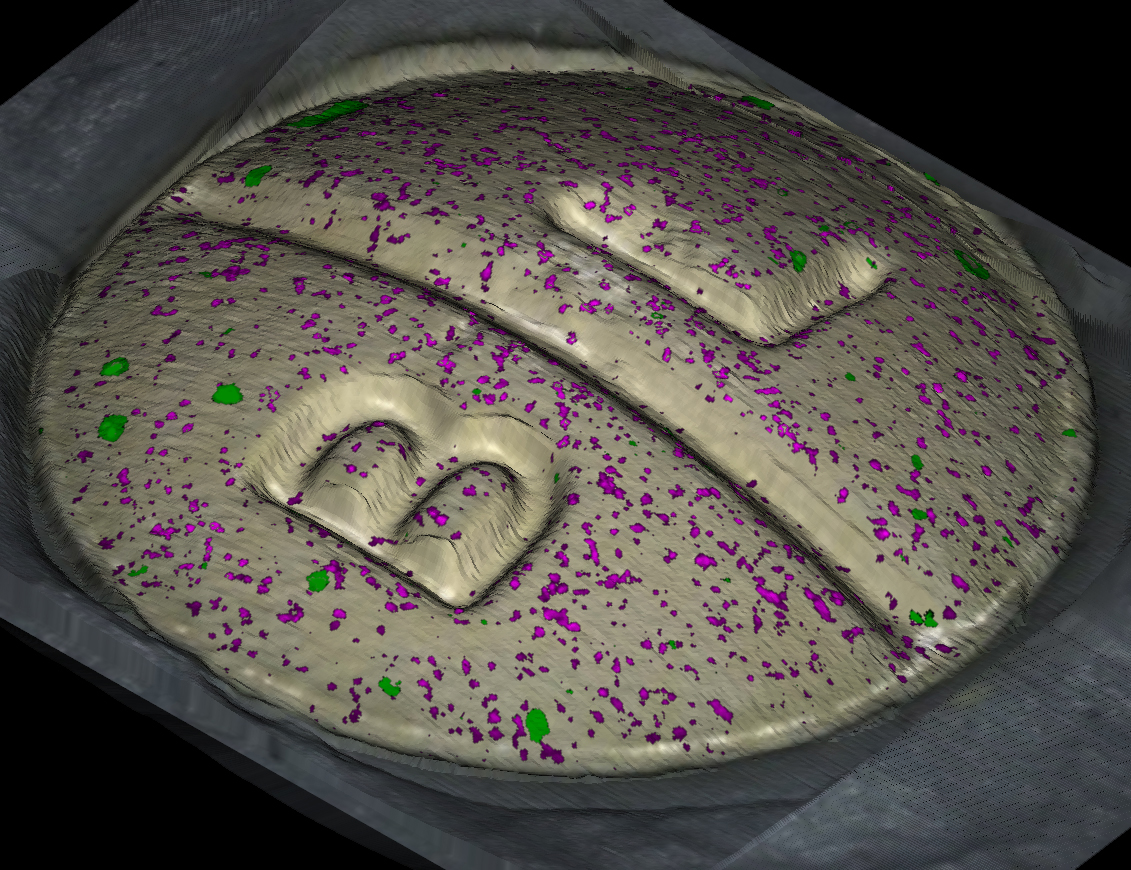
This webcast will present methods to characterize a range of pharmaceutical materials from contaminant particles through to powders and pressed tablets. The discussion will demonstrate how to optimize Raman data collection and analysis for the sample of interest.
US consumers buy 90 million pounds of chocolate for Halloween. We will demonstrate how Raman spectroscopy reveals the chemical and crystal structures of samples from the candy bowl.
We will show how the diverse high performing optical contrast methods of the inVia Raman microscope can be used to quickly, easily, and automatically report particle identities and morphology together.
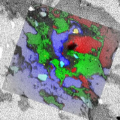
Raman spectroscopy is often one tool amongst the many required to solve complex research challenges. In this webinar, we will present Raman data collected in conjunction with other techniques such as; photocurrent measurements, PL, SEM, AFM, topography measurements and Rayleigh scattering.
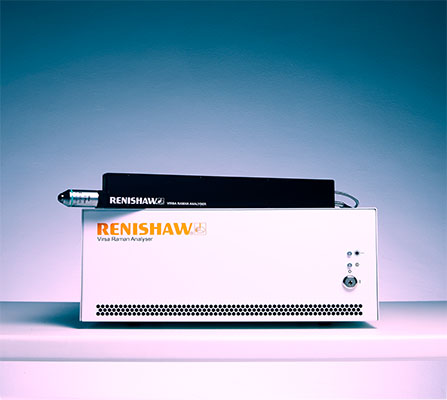
The Virsa Raman Analyser is Renishaw's latest innovation in fibre-optic Raman analysis. Learn how to optimise your experiments using fibre-optic probes for Raman spectroscopy.

Learn about the benefits of Raman spectroscopy in measuring the presence and stability of polymorphs in pharmaceutical formulations.
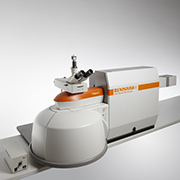
Learn about Renishaw's new confocal Raman microscope for trace material analysis in forensic laboratories
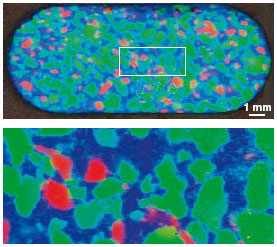
In this webinar, we will discuss how Raman spectrometers are ideal for the pre-formulation and in reverse engineering pharmaceutical products. Please note: This webinar is in Polish.